Understanding the Legwork for Data Visualization
Emma Kessinger
April 27th , 2020

The 21st century has been hailed as the “Age of Information,” and it’s not hard to see why — around 7.5 septillion gigabytes are generated every single day. With such a huge amount of data within reach, how are you expected to make sense of it all?
Thankfully, new tools are being developed all the time to help people develop an understanding of their data. One of the greatest assets any business person has when it comes to getting a grasp on all the numbers is data visualization, or the process of turning your data into a comprehensible format that makes it easy to identify and analyze trends.
Visualizing your Data
Data visualization is generally a complicated process that requires trained data analysts or data scientists. It generally starts with a data scientist who has a goal in mind to figure something out, and will often have an idea of how to represent it through either charts or graphs. Analysts typically help them put this together.
Once that goal is determined, they’ll start mining the data and taking the steps needed to visualize it.
1. Extract, Transform, and Load Data
In order to get your data in a format that you can use data visualization tools with, you need to first extract it from the source, transform it and clean up the data, and then load it into a data warehouse.
Extraction is vital because you likely have data coming in from many different sources. You could have Facebook Ad data that you’d like to look at in conjunction with customer data in HubSpot. The only way to see those two sets of data together is to extract them from their sources and load them into a centralized warehouse. Unless you’re well-versed data-centric programming, you’re likely going to want to use a service like ours in order to smooth out the technical aspects of extraction.
Transforming data involved cleaning the data to make it consistent and more easily understandable. In order to make your data easy to visualize, all of your data needs to be in a uniform format you’re comfortable reading and manipulating. For example, that means looking at something like a date and making sure it’s always in a month, date, year format from every source.
Lastly, you’ll load your data into a data warehouse. Properly stored data affords you the benefit of added centrality and security, which is especially important when dealing with personal customer data.
2. Identify What Data You Want to Look at
Once you’ve got your data where it needs to be and in the proper format, you can start the groundwork for visualization. In order to visualize your data, however, you need to have something to visualize — you don’t just want to show big groups of numbers, you want to show trends and patterns in your data.
This process — also known as data mining — is crucial for developing your visualizations later on. Think of trend identification as the planning stage of visualization: you’re figuring out what it is you want to eventually represent visually. Once you have a clear understanding of what your visualizations are going show and describe, you can move onto actually creating them yourself.
3. Represent the Data Through Graphics
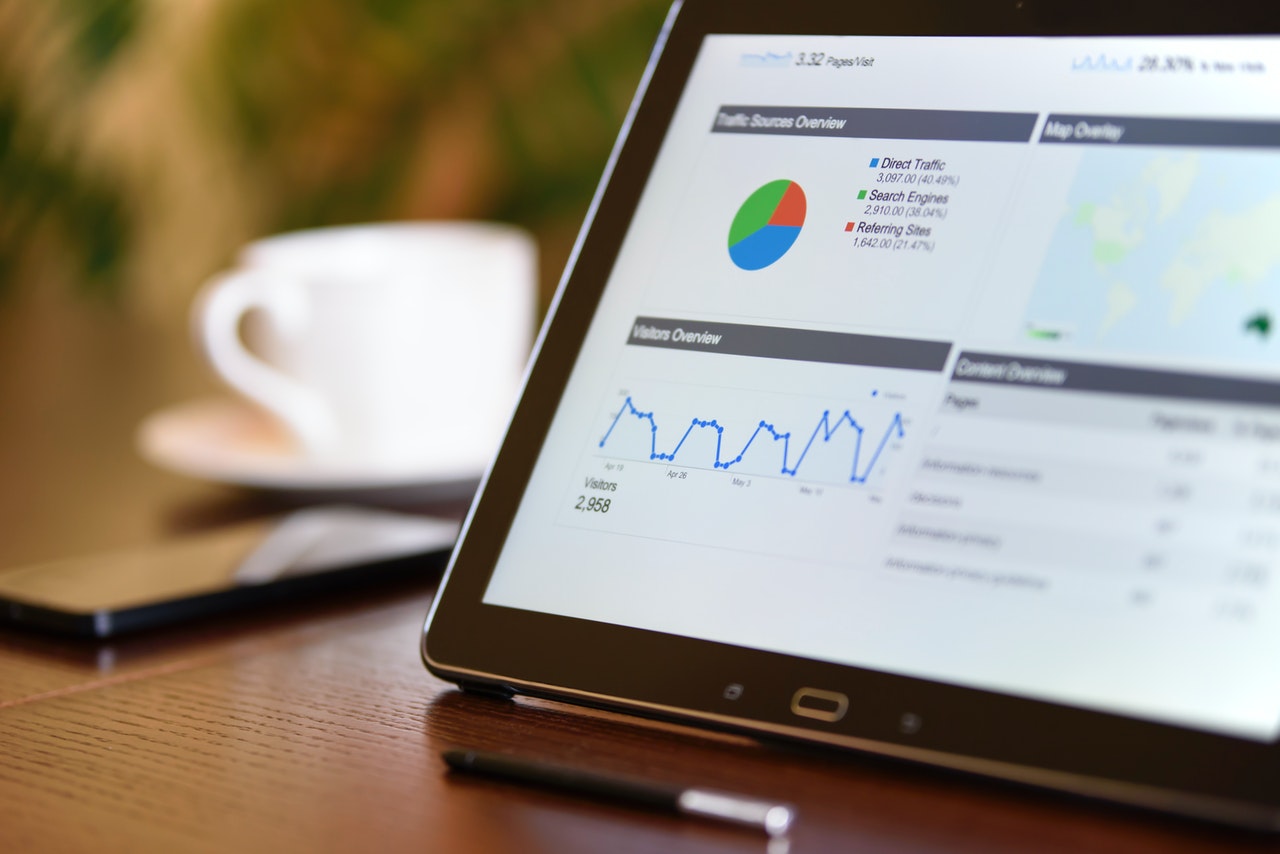
Representation is what most people think of when they hear “data visualization” — it’s the taking of findings from data and turning them into easily comprehensible graphics. Once you’ve finished the trend identification process, look at your findings and consider the formats in which they would best be presented.
Some data might work especially well with graphs or charts while some might best be represented on a map or timeline. There’s no one route for visualization, and different platforms will offer different options, but a carefully-considered plan will always produce a higher quality final product.
Data visualization requires some effort on your part before you can get to the actual representation, but the right services and platforms can allow you to spend the majority of your time on what’s important to you — making your data readable, insightful, and valuable.


